Infograph.app
Automatically creates infographics from textual data, ideas, and raw data using AI.
Are you the owner?
Claim this tool to publish updates, news and respond to users.
Sign in to claim ownership
Sign InDescription
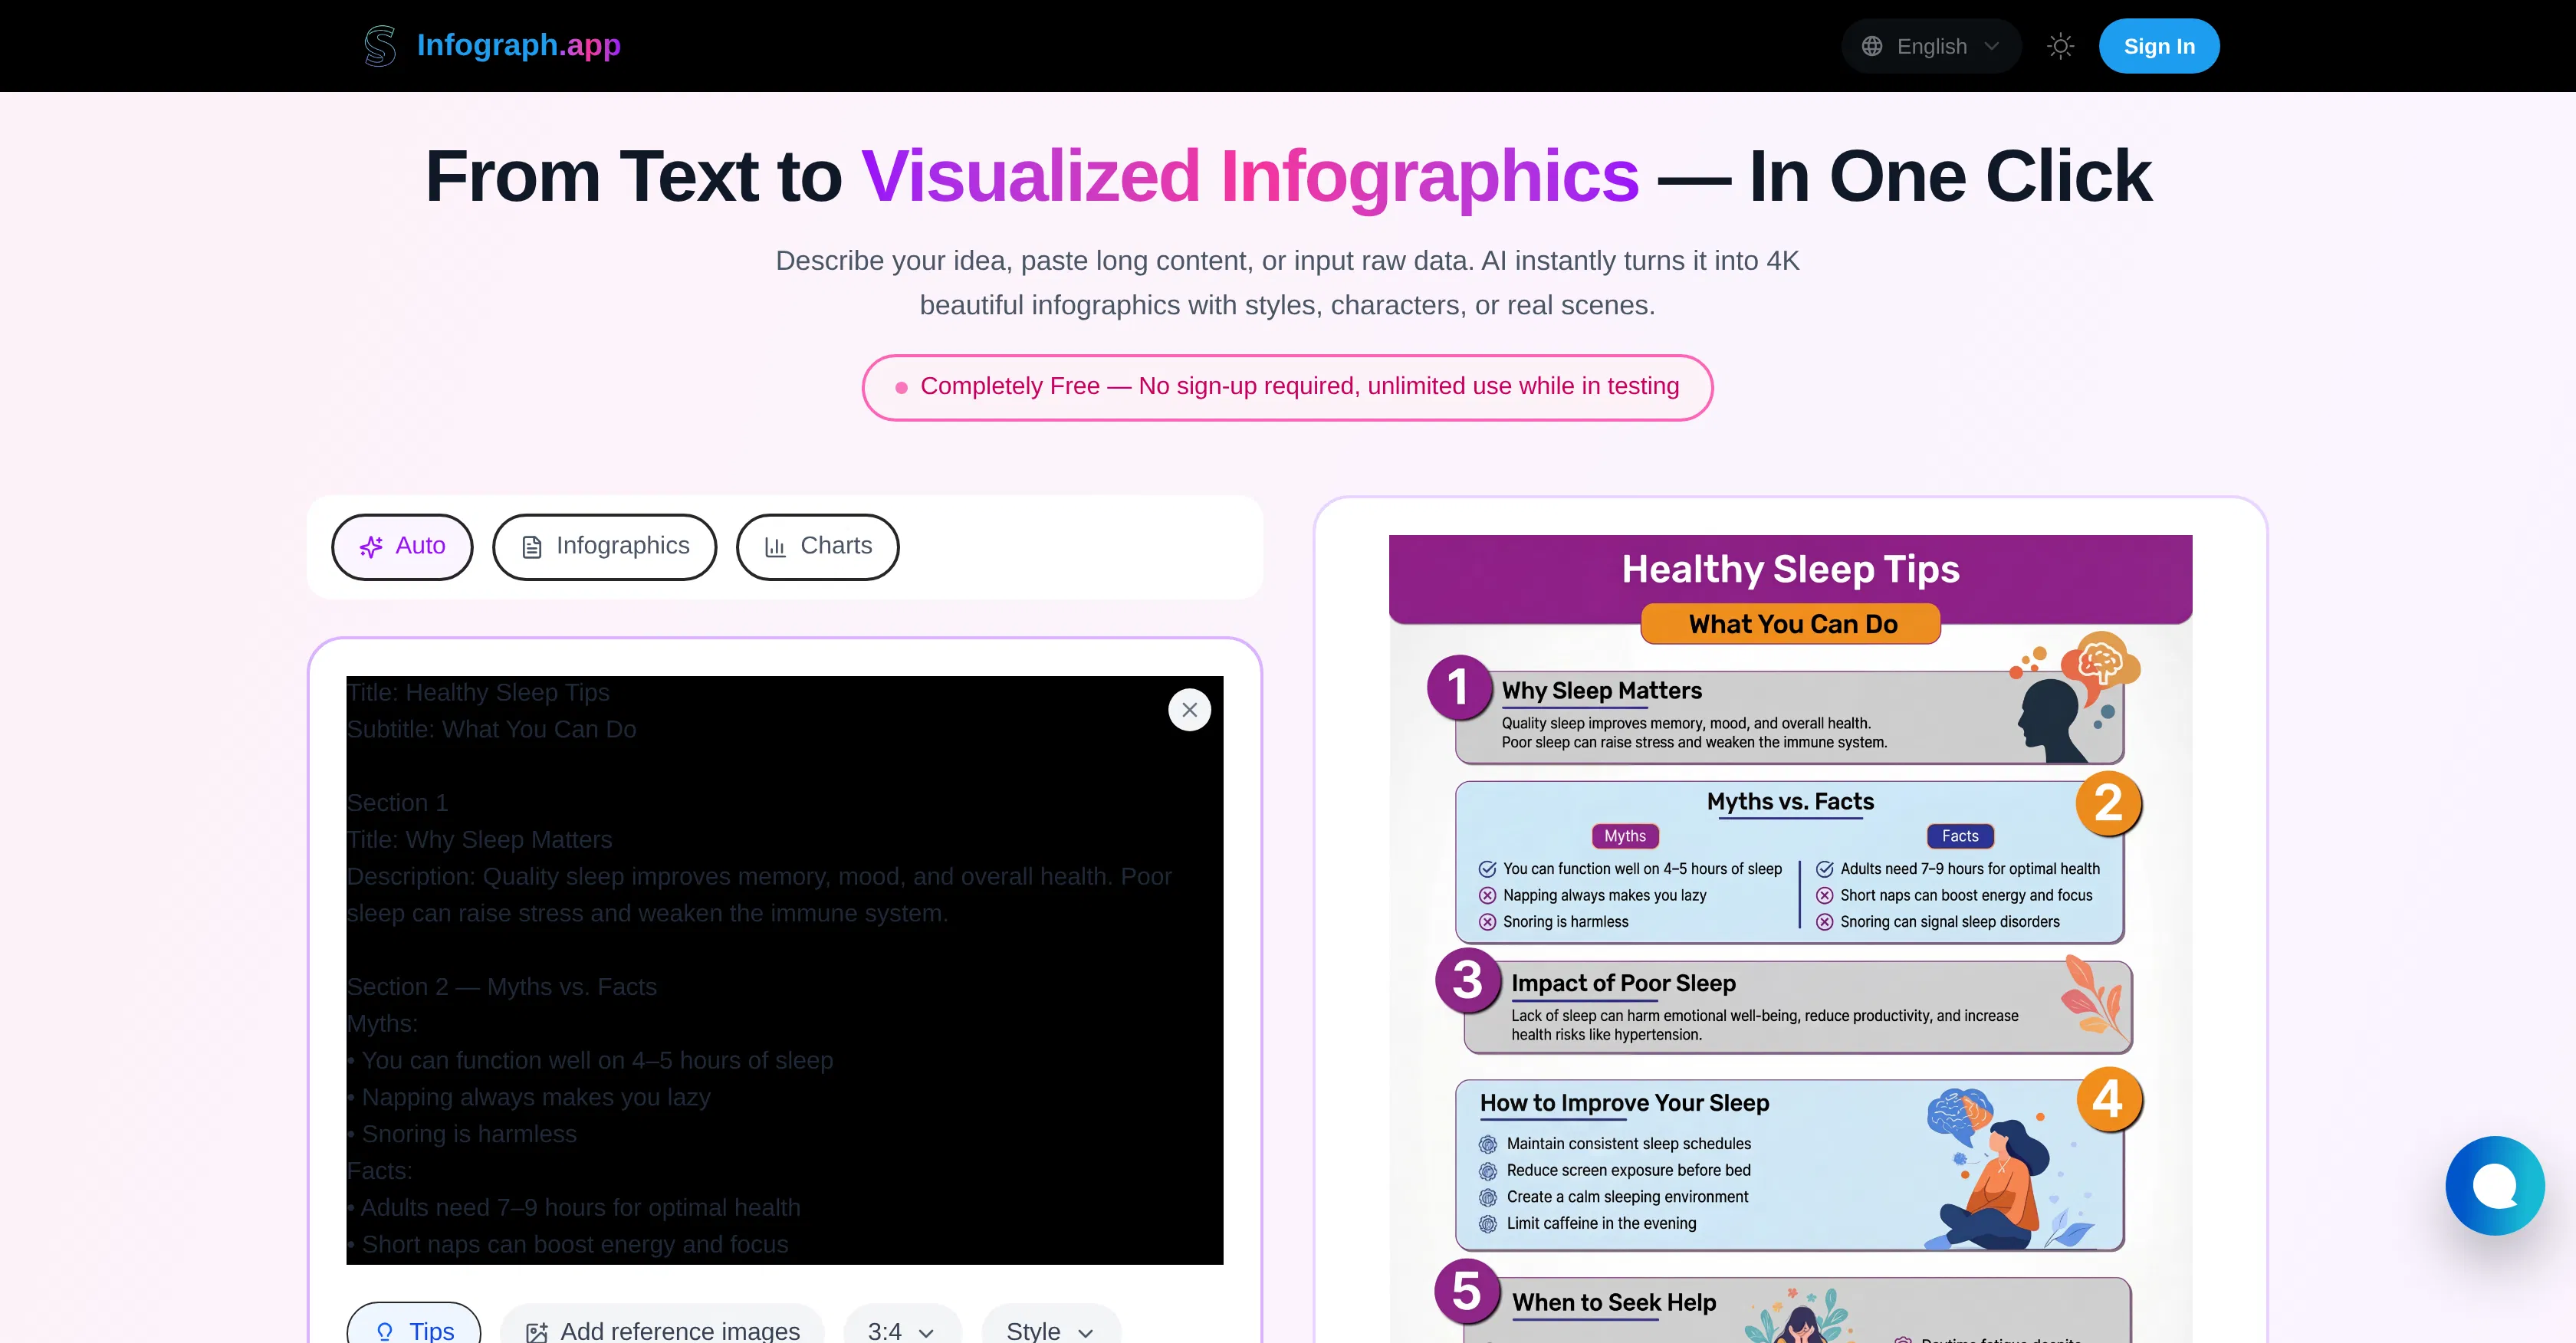
Infograph.app is an AI-powered infographic generator that transforms user-provided text, ideas, and raw data into compelling visual infographics. Developed to simplify the design process, its core value lies in automating the conversion of complex or lengthy information into clear, shareable visuals, saving significant time and effort for users without graphic design expertise. It serves as a bridge between data and visual communication, making information more accessible and engaging.
Key features: The tool can process long-form content and raw data, automatically structuring it into visual narratives. It supports an extensive library of over 300 chart types, including timelines, bar charts, and flow diagrams, to suit various data representation needs. Users can customize the generated infographics with different templates, color schemes, and branding elements. The platform also allows for easy export and sharing of the final visuals in common formats for presentations, reports, or social media.
What makes Infograph.app unique is its focus on a fully automated, AI-driven workflow from text to a complete visual layout, distinguishing it from manual design tools or simple chart builders. The underlying AI interprets the context and hierarchy of the input text to suggest appropriate visual structures. It is a web-based platform, requiring no software installation, and is designed for seamless use directly in a browser, though specific API integrations for embedding the functionality into other applications are not prominently detailed in the public description.
Ideal for marketers needing to create campaign reports, educators and trainers developing instructional materials, content creators and bloggers aiming to enhance articles, and business analysts or consultants who must present data findings clearly to clients or stakeholders. Specific use cases include turning a blog post summary into a social media infographic, visualizing survey results for a presentation, or creating a timeline for a project proposal without starting from a blank canvas.