InsightJini
Analyzes Excel/CSV data to generate instant insights and visualizations without coding.
Are you the owner?
Claim this tool to publish updates, news and respond to users.
Sign in to claim ownership
Sign InDescription
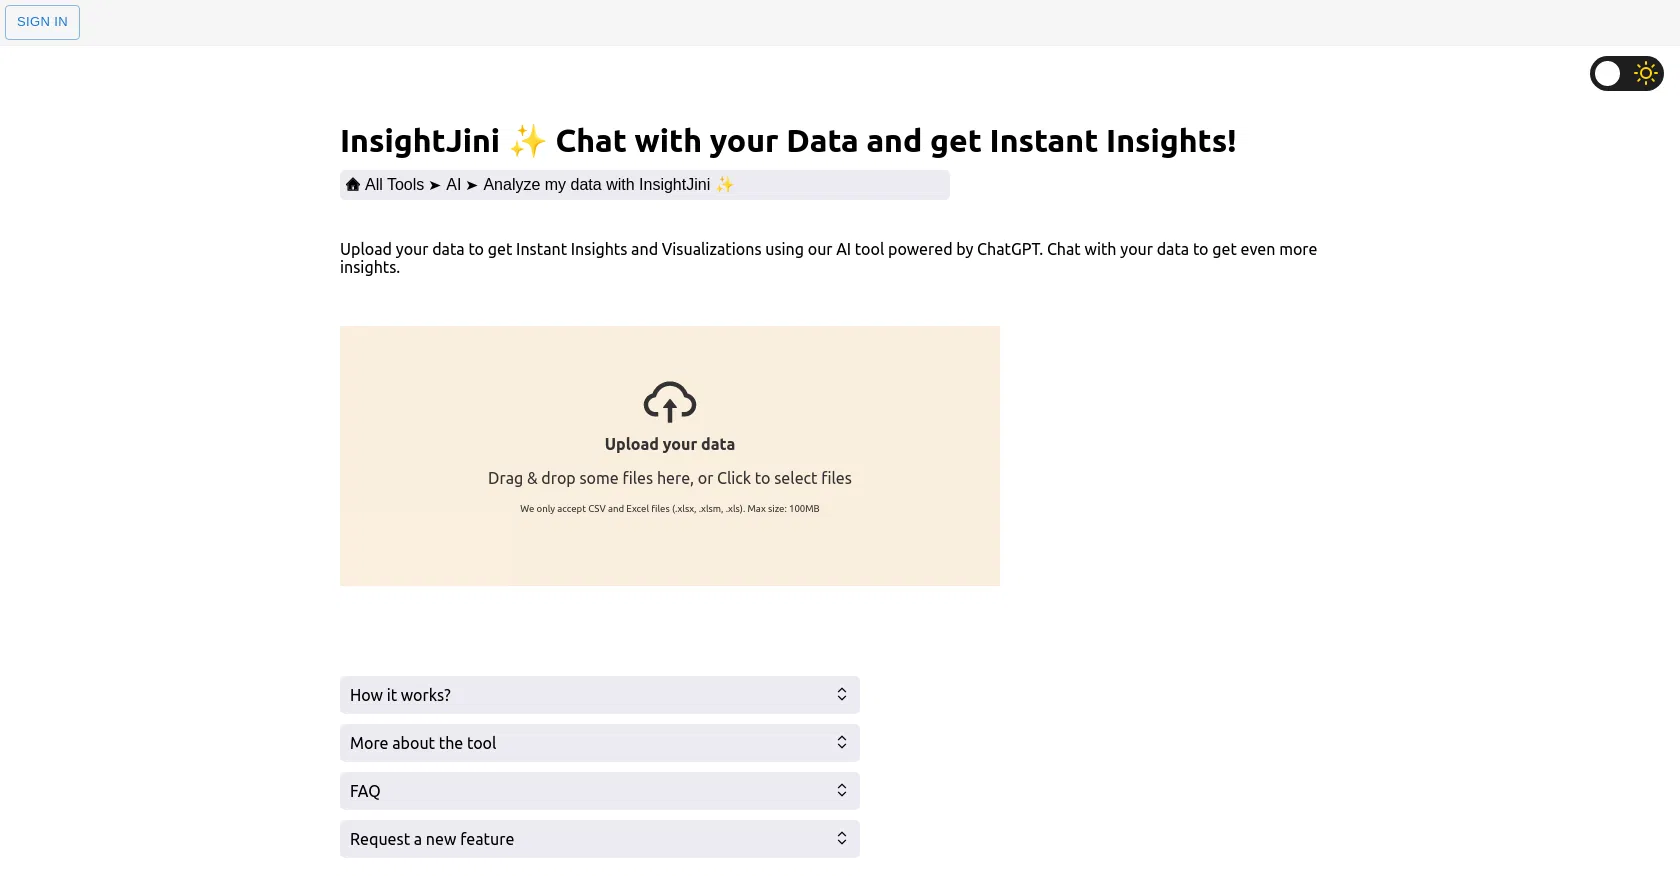
InsightJini is an AI-powered data analysis tool designed to democratize access to business intelligence by allowing users to upload their data and receive immediate, actionable insights and visualizations without requiring any programming expertise. Created to simplify the data exploration process, its core value lies in transforming raw spreadsheets into clear, understandable charts and summaries, enabling faster and more informed decision-making for professionals across various fields.
Key features include the ability to upload Excel or CSV files directly into an intuitive web interface, where the AI automatically reviews the data structure and suggests relevant analysis paths. Users can explore their data through a variety of chart types and graphical representations, ask natural language questions about their dataset to get specific answers, and generate summary reports that highlight key trends, outliers, and patterns. The platform is built to handle common data preparation tasks implicitly, reducing the time spent on data cleaning before analysis.
What sets InsightJini apart is its focus on a completely code-free, conversational approach to data interaction, positioning it as a bridge between complex data science and everyday business needs. Technically, it leverages machine learning models to understand data context and user intent, providing relevant visualizations and insights on the fly. It operates as a web-based platform with a responsive interface, ensuring accessibility from any modern browser without the need for software installation or integration with other systems, maintaining a standalone and user-friendly experience.
Ideal for business analysts, marketers, researchers, and small to medium business owners who need to make data-driven decisions but lack the time or technical skills for traditional data analysis software. Specific use cases include quickly analyzing sales reports to identify top-performing products, evaluating marketing campaign data to measure ROI, processing survey results to understand customer sentiment, and preparing visual data summaries for presentations or internal reports without relying on IT departments or data specialists.