VoxDeck
Creates presentations with 3D graphics and interactive elements for clear data visualization.
Are you the owner?
Claim this tool to publish updates, news and respond to users.
Sign in to claim ownership
Sign InDescription
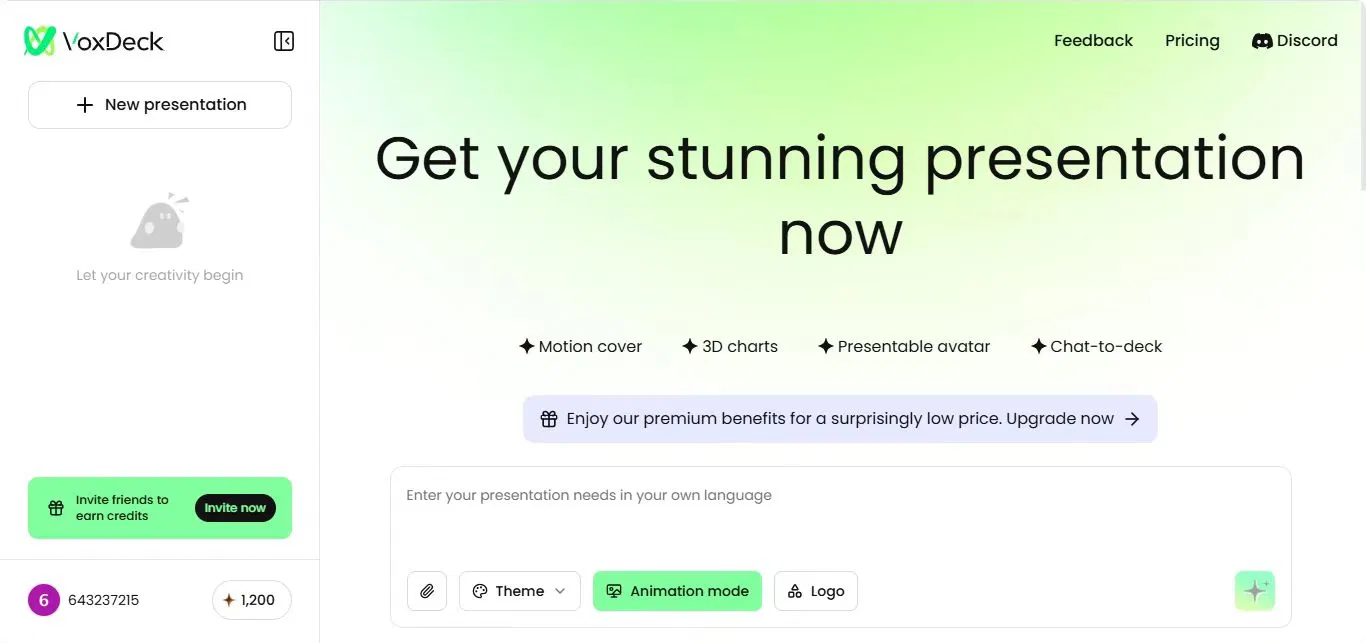
VoxDeck is a specialized service for creating modern presentations that focuses on data visualization through interactive 3D graphics and dynamic elements. The tool is positioned as a solution for professionals who need to go beyond static PowerPoint or Google Slides slides, turning dry numbers and reports into compelling visual narratives. While the exact technological foundation is not disclosed, the platform likely uses a combination of WebGL-based web rendering for 3D graphics and a proprietary editor with an AI assistant to simplify design.
Key features: Users can import data from CSV files or Google Sheets and instantly convert it into interactive 3D bar charts, surfaces, scatter plots, and complex choropleth maps. The key feature is interactivity: during a presentation, the audience can rotate, zoom, and click on graph elements to reveal detailed information. The platform also offers a library of animated UI components, embeddable media widgets, and tools for creating non-linear presentation scenarios where the narrative flow can change based on audience interests.
VoxDeck's uniqueness lies in its narrow specialization on three-dimensional and interactive data presentation, while most competitors like Beautiful.AI or Canva Presentations focus on template design and 2D animation. The technical advantage is operation directly in the browser without the need to install complex software, as well as the ability to publish the result as a web link that opens on any device while preserving all interactivity. The service offers several pricing plans, including a corporate version with white-label options and view analytics.
Ideal for data analysts, financial consultants, scientists, and marketers who need to present complex reports, research results, or business forecasts clearly and persuasively. Specific scenarios include preparing investor pitches with dynamic financial models, presenting quarterly sales analysis results to management, or creating interactive educational materials for educational institutions where students can independently explore data relationships.